






















Operations Quality Index
Operations Quality Assessment for
Multi-Outlet & Franchise Businesses
Find out how well your outlets really run, from audits and SOPs to data visibility and outlet profit. Answer a few quick multiple-choice questions in under 10 minutes and get a personalised scorecard showing where your operations are strong and where they're leaking.
What is the Operations Quality Assessment?
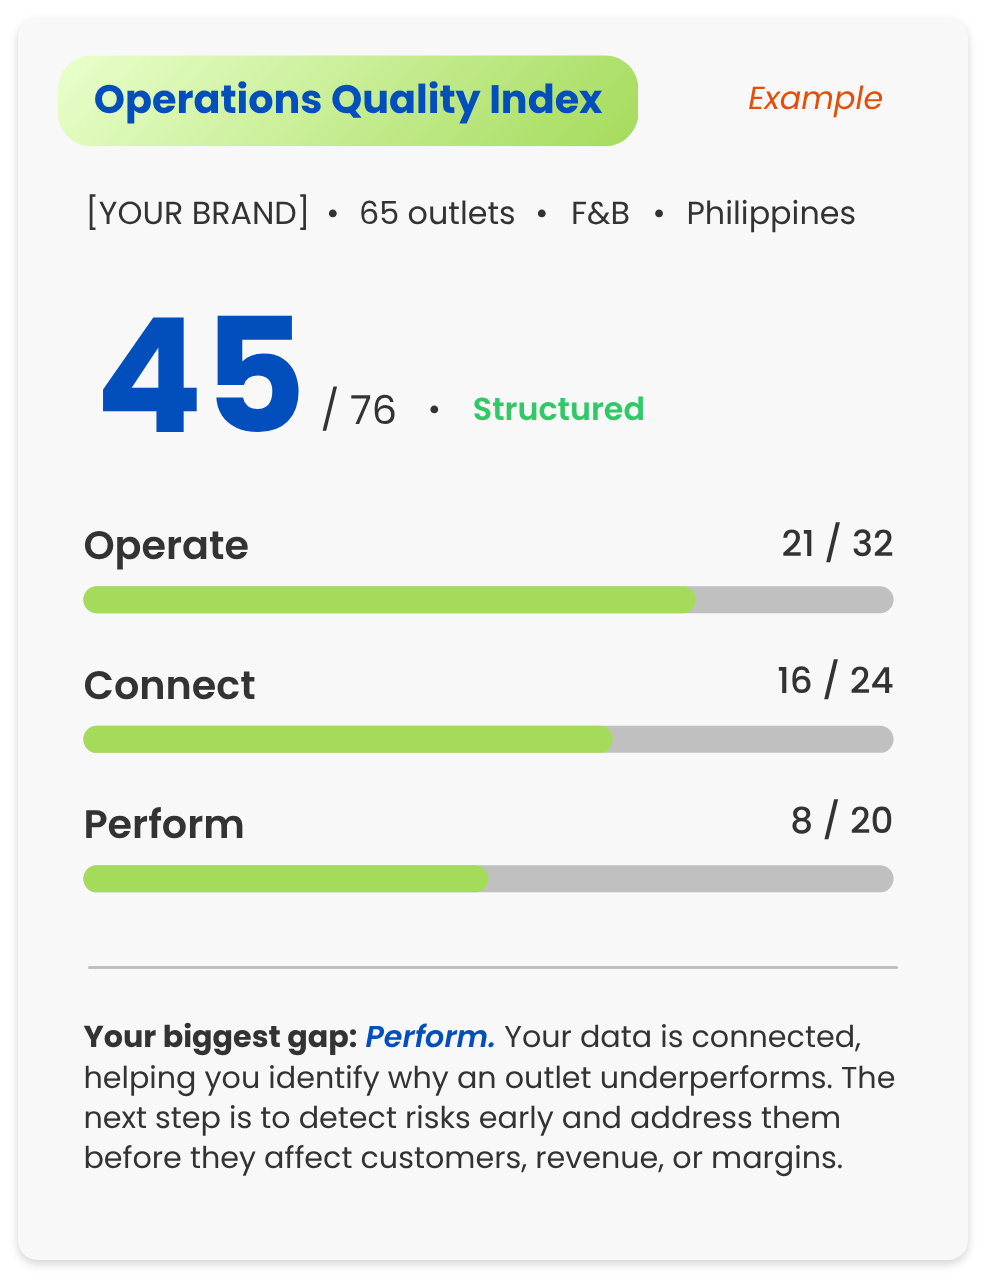
The Operations Quality Assessment is a free self-assessment for businesses that run many outlets. It looks at three parts of your operations: how well outlets run to standard, how clearly HQ can see what's happening, and how well you link operations to sales and profit.
Each answer is scored. You get a score for each area and an overall score, so you can see exactly where to focus first.
Common Operations Challenges in
Multi-Outlet and Franchise Businesses
Could you name your five weakest outlets, and why, in under a day?
If not, the gap is usually between what happens at your outlets and what
reaches the people who need to act on it. Here's how that shows up in each
role.
Owners, CEOs & Franchisors

COOs & Head of Operations
Area & Regional Managers
If a few of these sound familiar, the assessment will show
you which level your operations are at, and which area is
holding you back most.

What We Measure
How we assess operational performance? We look at three areas:

Operate
Do your outlets
run to standard?
How audits are done, how fast issues get fixed, whether problems repeat, how SOPs reach outlets, and whether skills gaps lead to training.

Connect
How well connected
are your operations?
Where your operational data is stored, how well your systems work together, how HQ and outlets share updates, and how easily leadership can access reliable information.

Perform
Can you link operations to
revenue, cost, and margin?
How often you review outlet-level P&L, whether you can see sales and ops data side by side, how fast you find the cause when an outlet drops, and how managers are held accountable.
What is Your Operations Score?
Reactive
0–19 ptsProblems are found
by customers
Operations run on memory, chat messages and paper. Issues surface only when a customer complains or a number drops, and by then the damage is done.
Developing
20–38 ptsData exists, but it arrives
late and in pieces
Processes are tracked, but the data lives across separate systems. HQ spends time chasing updates and compiling reports, often making decisions based on last month's results.
Structured
39–57 ptsDigitalised, but
not connected
Audits, checklists and training are mostly digital and running consistently. But operational data remain separate from sales and costs, making it difficult to identify the root causes of declining outlet performance.
Predictive
58–76 ptsRisks are flagged early
Data from across the network is connected, helping managers identify recurring issues, coach teams based on actual performance, and address problems before they affect customers or financial results.
What You Get From The Assessment

Your personalised scorecard
Your score in each of the three areas, plus your overall score.

A 20-minute results walkthrough
Go through your scores with our team and find the gap worth fixing first.
Ready to improve your operations?
See how you can connect your operations, improve outlet performance, and manage your network more effectively. Book a demo with our team, and we'll walk you through how TreeAMS can help.