





















TreeAMS - How to Measure Operations Quality Across Your Outlets: The 4 Stages of Operational Maturity
Learn how to measure operations quality across multiple outlets using three key areas: Operate, Connect and Perform. Discover the four stages of operational maturity and find out how to benchmark your
To measure operations quality across multiple outlets, look at three things: how well daily work is done (Operate), how well your data is connected (Connect), and how well you use it to protect results (Perform). Most multi-outlet businesses sit in one of four stages: Reactive, Developing, Structured or Predictive. The free Operations Quality Assessment tells you which stage you're in.
Ask any multi-outlet operator how their business is doing, and they can tell you their sales. Ask how well their outlets are actually run, and the answer gets vague. "Most outlets are fine." "We had a bad audit in one region." "We'll know at the month-end review."
That gap matters. Sales tell you what already happened. Operations quality tells you what is about to happen: the training gap that becomes a failed audit, the repeat issue that becomes a customer complaint, the slipping outlet that shows up in the P&L six weeks later.
This guide explains how to measure operations quality across your outlets, the four stages of operational maturity, and how to tell which stage your business is in today.
Why operations quality is hard to measure across multiple outlets
With one outlet, an owner can monitor quality firsthand. But across 20, 50, or 200 outlets, that becomes increasingly difficult for three reasons:
- Operational data is fragmented: Audits, checklists, training records, and issue reports are stored across separate systems and channels, making it difficult to assess performance across outlets.
- Reporting is delayed: Manual report compilation means leaders often make decisions based on outdated results.
- Operational data is disconnected from business results: Audit scores alone cannot explain whether an outlet's sales or costs are at risk. For example, an outlet may score 85% on its audit while its wastage rises and its sales fall. Unless the audit results sit next to the outlet's sales and cost data, nobody connects the two until the month-end P&L.
The result is reactive management. Issues are often identified only after customer complaints or declining performance reveal them, when corrective action may already be overdue.
What to measure: the 3 areas of operations quality
A useful operations quality assessment looks at three areas. Each one builds on the one before it.
- Operate: how well daily work gets done
- What share of your outlets met your brand standard at the last audit?
- On average, how long does it take to close an issue found in an audit?
- How often do the same issues come back at the same outlet?
- Connect: how well your operational data fits together
- Where does most of your operational data live: paper, chat groups, spreadsheets, several apps, or one connected platform?
- How confident are you that the operational data reported to leadership is accurate?
- Could you name your bottom 10% of outlets, and explain why, within one working day?
- Perform: how well you use data to protect results
- How often do you review profit and loss at individual outlet level?
- When an outlet's sales or margin drops, how quickly do you find the operational cause?
- Are outlet managers or franchisees held accountable with a scorecard that combines sales, costs and compliance?
This is the foundation: audits, SOPs, training and issue handling at outlet level. It measures whether standards are written down, followed, checked and fixed when they slip.
Quick self-check:
This area looks at where your data lives and whether it links up: operations tools, POS, inventory, HR or rostering, and finance. It also covers how HQ and outlets (or franchisees) share updates and SOP changes.
Quick self-check:
This is where operations meets the P&L. It measures whether you can see each outlet's sales and costs next to its audit scores, issues and training, and act before a drop shows up in the numbers.
Quick self-check:
If you found several questions difficult to answer, you may have established processes for Operate, but still face challenges with Connect and lack sufficient data to assess Perform.
How does your operation score? 20 questions across Operate, Connect and Perform. See your score and stage as soon as you finish.
Take the free assessmentThe 4 stages of operational maturity: which one is your business at?
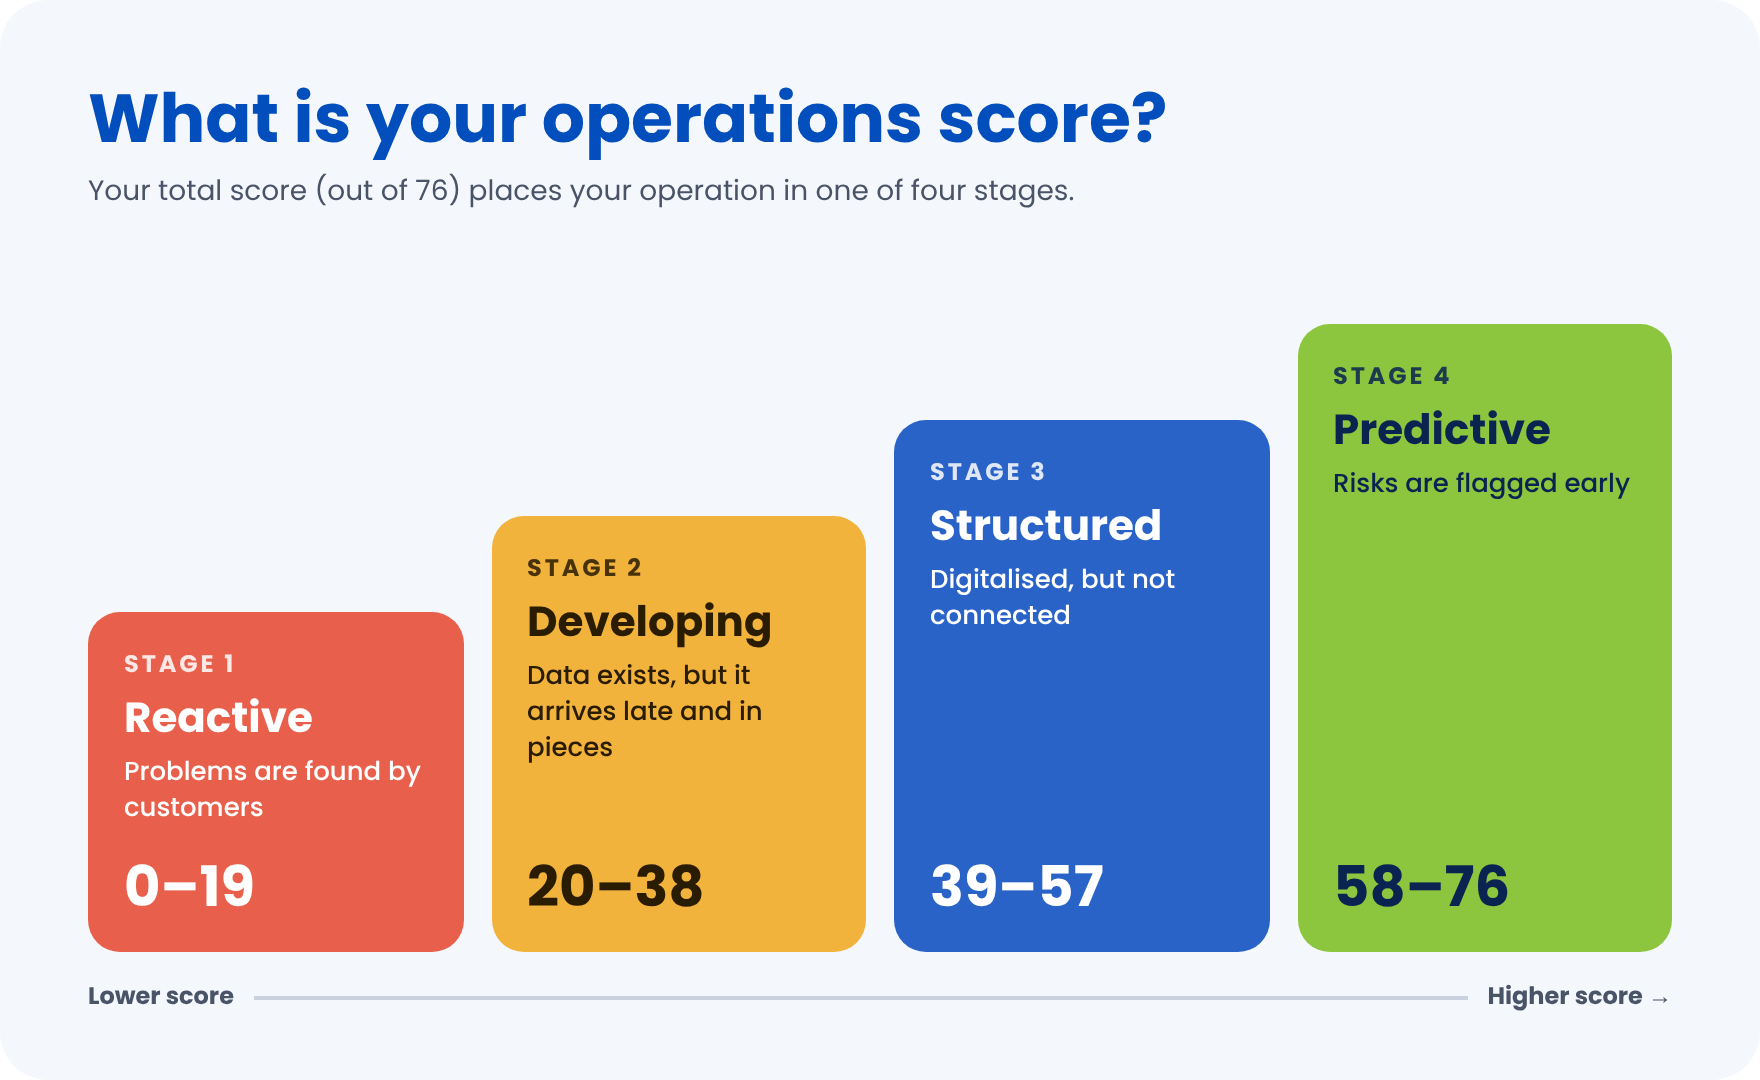
The Operations Quality Assessment scores 20 questions from 0 to 4. Your total places you in one of four stages.
Stage 1, Reactive: problems are found by customers
Operations run on memory, chat messages and paper. Issues surface only when a customer complains or a number drops, and by then the damage is done.
You're likely here if:
- Audits are irregular or done on paper.
- SOPs live mostly in people's heads.
- Issues are passed on verbally or in chat, with no owner or deadline.
What it costs you: Every problem is found late and fixed once. The same issues come back, because nothing records them or checks that the fix held. Leaders spend their time firefighting, and the business depends on a few experienced people remembering how things should be done. When they leave, the standard leaves with them.
What to improve first:
- Write your standards down. Start with the SOPs and opening and closing checklists that matter most for food safety, service and brand.
- Start a regular audit cycle. Even a simple one, so every outlet is checked the same way on a fixed schedule.
- Give every issue an owner and a deadline. Stop passing problems on verbally or in chat, where they get lost.
Stage 2, Developing: data exists, but it arrives late and in pieces
Processes are tracked, but the data lives across separate systems. HQ spends time chasing updates and compiling reports, and decisions are often based on last month's results.
You're likely here if:
- Audits and checklists run on spreadsheets or online forms.
- Getting a view across all outlets takes a monthly report.
- Training completion is only visible after someone compiles it.
What it costs you: You have data, but it's slow and scattered. Managers spend more time compiling reports than acting on them. Because each system shows only part of the picture, it's hard to compare outlets fairly or spot a pattern across the network. Decisions are still made after the damage is done, just with better records of it.
What to improve first:
- Bring your records into one digital system. Move audits, checklists, training and issues off paper, spreadsheets and chat, so every result is time-stamped and comparable across outlets.
- Shorten the reporting cycle. Replace the monthly compiled report with a weekly, or live, view across all outlets.
- Close the training loop. When an audit shows a skills gap, assign retraining, track it, and check the same standard again at the next audit.
Stage 3, Structured: digitalised, but not connected
Audits, checklists and training are mostly digital and running consistently. But operational data stays separate from sales and costs, so it is hard to find the root cause when an outlet's performance drops.
You're likely here if:
- You use one or more apps for audits, checklists or training.
- Operational data and POS or finance data are combined by hand, if at all.
- You can name your weakest outlets, but not always explain why.
What it costs you: Execution is strong, but you can't see what it's worth. Operational data and business data live in separate systems, so you can't tell which gaps are hurting sales or costs. Many operators stop here, because their tools stop at execution and reports. They show that work was done, but not whether it made a difference.
What to improve first:
- Connect operations to sales and costs. Put each outlet's sales and key costs next to its audit scores, issues and training, in one view.
- Flag slipping outlets automatically. Set alerts so your bottom 10% of outlets are identified with the reasons, not found at the month-end review.
- Review outlet P&L more often. Move to at least a monthly outlet-level review, and read it alongside the operational data.
Stage 4, Predictive: risks are flagged early
Data from across the network is connected. Managers can spot recurring issues, coach teams based on actual performance, and fix problems before they affect customers or financial results.
You're likely here if:
- Each outlet's sales and costs sit next to its audit scores, issues and training in one view.
- Your bottom 10% of outlets are flagged automatically, with the reasons.
- Outlet managers or franchisees are measured on a scorecard that combines sales, costs and compliance.
What it takes to stay here: Predictive operations need clean, connected data and the discipline to act on it. The goal isn't more reports. It's fewer surprises: managers coach instead of chase, franchisee conversations are based on facts, and problems are fixed before they reach customers or the P&L.
What to improve first:
- Measure the cost of operational lapses. Track how failed audits, stock-outs and slow fixes affect sales and costs, and set targets for them.
- Tie scorecards to accountability. Hold outlet managers or franchisees to a scorecard that combines sales, costs and compliance, reviewed with live data and linked to incentives.
- Keep the data clean. Review what you track as SOPs, outlets and teams change, so the early warnings stay accurate.
Not sure which stage you're in? Answer 20 questions and get your score, your stage and a personalised scorecard.
Button: Find your stageFAQs about the Operations Quality Assessment
What is an operations quality assessment?
It's a structured way to measure how well a multi-outlet business runs its operations. It looks at three areas, how daily work gets done (Operate), how well data is connected (Connect) and how well that data protects results (Perform), and places the business in one of four maturity stages.
How is the score calculated?
The assessment has 20 scored questions, each worth 0 to 4 points. Your total places you in a stage: Reactive (0–19), Developing (20–38), Structured (39–57) or Predictive (58–76).
How long does the assessment take?
The assessment takes less than 10 minutes. You'll see your score and stage on screen as soon as you finish.
Who is the assessment for?
It's built for owners, C-suite leaders, heads of operations and area managers running multiple outlets in F&B, retail, beauty and wellness, fitness, education and services, including franchise networks.
What do I get after taking the assessment?
Your score and stage on screen right away. You can also choose to receive a personalised scorecard and an early copy of the benchmark report once enough operators have taken part.
Take the Operations Quality Assessment
Knowing your stage is the first step to moving up. The assessment takes a few minutes and shows you exactly where your operations are strong, and where the gaps are.
Get your Operations Quality score Free, 20 scored questions. See your stage right away, and get an early copy of the benchmark report.
Start the assessment
No comments yet. Login to start a new discussion Start a new discussion